keras를 이용한 시계열 분석 연습
이 Posting 은 Time Series를 공부하다가 찾게된, 다른 분의 Blog 의 Posting 코드를 따라서, 연습해가는 과정이다.
import keras
keras.__version__
Using TensorFlow backend.


'2.2.4'
Cosine 데이터 만들기
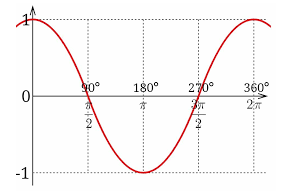
코사인 함수 image 기억하기 ㅋ
import numpy as np
signal_data = np.cos(np.arange(1600)*(20*np.pi/1000))[:,None]
## (20*np.pi/1000) : 진폭을 변경하기 위한 옵션
20*np.pi/1000
0.06283185307179587
signal_data.shape
(1600, 1)
%matplotlib inline
import matplotlib.pyplot as plt

plot_x = np.arange(1600)
plot_y = signal_data
plt.plot(plot_x, plot_y)
plt.show()

학습을 위한, train 데이터와 target 데이터 만들기
시계열 데이터는 이전과는 달리, 트레인 데이터는 이전 수치들이 되고, 타겟데이터 (label) 데이터는 다음 수치들이 된다.
트레인 데이터와 라벨이 모두 같은 속성이다.
## 데이터셋 만들기 위한 함수
def create_dataset(signal_data, look_back=1):
    dataX, dataY = [], []
    for i in range(len(signal_data)-look_back):
        dataX.append(signal_data[i:(i+look_back), 0]) # 0~ (i+look_back) 인데, numpy slice 에서, 마지막 index는 제외니, i+look_back - 1 까지를 일컫는다.
        dataY.append(signal_data[i + look_back, 0]) # (i+look_back) 이 target
    return np.array(dataX), np.array(dataY)
- signal_data : 활용할 데이터 셋
- look_back : 학습때 활용할 timestamp 상의 기간. 1 이면, 바로 직전의 값을 활용하고, 10 이면, timestamp 상에서, 10 전의 것을 사용한다는 의미
look_back 인자에 따라 모델의 성능이 달라지므로 적정 값을 지정하는 것이 중요함
from sklearn.preprocessing import MinMaxScaler

# 데이터 전처리 (scale 조정 cos 값은 -1 ~ 1 을 가짐.)
scaler = MinMaxScaler(feature_range=(0, 1))
signal_data = scaler.fit_transform(signal_data)
print(np.min(signal_data),'\t',np.max(signal_data))
0.0 1.0
print("signal_data.shape:{}".format(signal_data.shape), "\t signal_data.ndim:{}".format(signal_data.ndim))
signal_data.shape:(1600, 1) signal_data.ndim:2
# 데이터 분리
train = signal_data[0:800]
val = signal_data[800:1200]
test = signal_data[1200:]
look_back = 40
# 데이터셋 생성
x_train, y_train = create_dataset(train, look_back)
# train 는 800 임. 따라서, 800 - 40 = 760 번의 for 문을 돈다.
# train 데이터는 1회 loop 시마다, 계속 1차원의 데이터를 생성하여 append 하게되면, 최종적으로는 2차원 데이터가 완성된다. Feature 특성으 0 으로 지정 1개를 가져옴으로 Vector 처럼 되었다.
# target 데이터도 1회 loop 시마다, 계속 1차원의 데이터를 생성하여 append 하게되면, 최종적으로는 2차원 데이터가 완성된다.
x_val, y_val = create_dataset(val, look_back)
x_test, y_test = create_dataset(test, look_back)
print(signal_data[0:3,0].shape)
print("x_train.shape",x_train.shape) # 1행이 40개의 timestamp 이고, feature 는 그 자체 1개이다. 즉1개행은 40개의 time stamp 를 가진 값이다. 1차원 벡터이다.
print("x_val.shape",x_val.shape,"x_test.shape",x_test.shape)
(3,)
x_train.shape (760, 40)
x_val.shape (360, 40) x_test.shape (360, 40)
# 데이터셋 전처리 ## LSTM 을 사용하기 위해서는 (batch_size,time_stmpa,feature_dim) 의 3차원으로 변경되어야 한다.
x_train = np.reshape(x_train, (x_train.shape[0], x_train.shape[1], 1))
x_val = np.reshape(x_val, (x_val.shape[0], x_val.shape[1], 1))
x_test = np.reshape(x_test, (x_test.shape[0], x_test.shape[1], 1))
print(x_train.shape) # 1행이 40개의 timestamp 이고, feature 는 그 자체 1개이다. 즉1개행은 40개의 time stamp 를 가진 값이다. 1차원 벡터이다.
print(x_val.shape)
(760, 40, 1)
(360, 40, 1)
numpy squeeze 함수 remind Start
tx = np.array([[[0], [1], [2]]])
print(tx.shape)
print(np.squeeze(tx).shape) ## tx[0].ndim
print(np.squeeze(tx, axis=0).shape)
# print(np.squeeze(tx, axis=1).shape) ## axis=1 에 해당하는 data가 single dim (1) 이 아니라서, 에러난다. 어느 값을 남겨야 할지 모르기 때문 1춰원짜리가 3개있다.
print(np.squeeze(tx, axis=2).shape)
(1, 3, 1)
(3,)
(3, 1)
(1, 3)
numpy squeeze 함수 remind End
학습하기
다층퍼셉트론 모델
시계열 예측에, 기존의 완전Fully connected layer를 적용해본다. 시계열 전용 네트워크 구조는 아닌다.
## 근데, 왜 3차원인것을 다시 Squeeze로 2차원으로 넣는 이유는 기존처럼, Dense layer에 활용하기 위해선, 2dim 의 데이터가 들어가야하기 때문
## 앞선 post 에서는 완전연결층 사용 시에는 모델에 Flatten() 을 넣어줬다.
x_train = np.squeeze(x_train)
x_val = np.squeeze(x_val)
x_test = np.squeeze(x_test)
print(x_train.shape) # squeeze 하면, 차원 1인 값들은 차원이 없어짐.
print(x_val.shape)
print(x_test.shape)
(760, 40)
(360, 40)
(360, 40)
from keras.models import Sequential
from keras.layers import Dense, Activation,Dropout
# 1. 모델 구성하기
model = Sequential()
model.add(Dense(32,input_dim=40,activation="relu"))
model.add(Dropout(0.3))
model.add(Dense(32,activation="relu"))
model.add(Dropout(0.3))
model.add(Dense(32,activation="relu"))
model.add(Dropout(0.3))
model.add(Dense(1))
WARNING:tensorflow:From C:\ProgramData\Anaconda3\envs\test\lib\site-packages\tensorflow\python\framework\op_def_library.py:263: colocate_with (from tensorflow.python.framework.ops) is deprecated and will be removed in a future version.
Instructions for updating:
Colocations handled automatically by placer.
WARNING:tensorflow:From C:\ProgramData\Anaconda3\envs\test\lib\site-packages\keras\backend\tensorflow_backend.py:3445: calling dropout (from tensorflow.python.ops.nn_ops) with keep_prob is deprecated and will be removed in a future version.
Instructions for updating:
Please use `rate` instead of `keep_prob`. Rate should be set to `rate = 1 - keep_prob`.
# 2. 모델 학습과정 설정하기
# model.compile(loss='mean_squared_error', optimizer='adagrad') # ,metrics=None 이다. 이는 rmse 이기 때문. ,metrics=['mae']
model.compile(loss='mean_squared_error', optimizer='adagrad',metrics=['mae']) # ,metrics=None 이다. 이는 rmse 이기 때문.
# 3. 모델 학습시키기
hist = model.fit(x_train, y_train, epochs=200, batch_size=32, validation_data=(x_val, y_val),verbose=False)
WARNING:tensorflow:From C:\ProgramData\Anaconda3\envs\test\lib\site-packages\tensorflow\python\ops\math_ops.py:3066: to_int32 (from tensorflow.python.ops.math_ops) is deprecated and will be removed in a future version.
Instructions for updating:
Use tf.cast instead.
# 4. 학습과정 살펴보기
plt.plot(hist.history['loss'])
plt.plot(hist.history['val_loss'])
plt.ylim(0.0, 0.15)
plt.ylabel('loss')
plt.xlabel('epoch')
plt.legend(['train', 'val'], loc='upper left')
plt.show()

# 5. 모델 평가하기
trainScore = model.evaluate(x_train, y_train, verbose=0)
print('Train Score: ', trainScore)
valScore = model.evaluate(x_val, y_val, verbose=0)
print('Validataion Score: ', valScore)
testScore = model.evaluate(x_test, y_test, verbose=0)
print('Test Score: ', testScore)
Train Score:  [0.0062621283099839565, 0.06481785985984301]
Validataion Score:  [0.0062851937694682015, 0.06513945526546902]
Test Score:  [0.0062851937694682015, 0.06513945526546902]
0번째 컬럼이, loss 값이고, 1번째 값이 metric 여기서는 MAE 값임
print(x_test.shape)
(360, 40)
# 6. text 값 예측하기
look_ahead = 3
xhat = x_test[0, None] # 360개중 처음 0 번째 data 인데, 2차원으로 추출하기 위해 [] 사용함
print("before xhat.shape {}".format(xhat.shape))
predictions = np.zeros((look_ahead,1)) ## 2차원짜리 zero matrix 제작 (250,1)
for i in range(look_ahead): # 왜 250번을 돌리는지는 모르겠다.
    prediction = model.predict(xhat) # batch_size=32 는 없어도 되는듯.
    predictions[i] = prediction
    print("01 xhat.shape {}".format(xhat[:,1:].shape),"prediction.shape {}".format(prediction.shape))
    xhat = np.hstack([xhat[:,1:],prediction]) ## xhat[:,1:] = (1,39), (1,1) 의 hstack 결과값을 다시 xhat 으로 바꿔치기 한다.
    ## 예측값 prediction 을 xhat의 맨 마지막 값(마지막time_stamp) 에 덧붙인다. 즉, 예측값이라고 할 수 있다. 이때, 맨 앞의 timestamp 값는 제거한다.
    print("02 [xhat[:,1:],prediction] {}".format(type([xhat[:,1:],prediction])))
    print("03 after hstck xhat.shape{}".format(xhat.shape),"\n")
before xhat.shape (1, 40)
01 xhat.shape (1, 39) prediction.shape (1, 1)
02 [xhat[:,1:],prediction] <class 'list'>
03 after hstck xhat.shape(1, 40)

01 xhat.shape (1, 39) prediction.shape (1, 1)
02 [xhat[:,1:],prediction] <class 'list'>
03 after hstck xhat.shape(1, 40)

01 xhat.shape (1, 39) prediction.shape (1, 1)
02 [xhat[:,1:],prediction] <class 'list'>
03 after hstck xhat.shape(1, 40)
# 6. text 값 예측하기 - original 코드
look_ahead = 250
xhat = x_test[0, None]
predictions = np.zeros((look_ahead,1))
for i in range(look_ahead):
    prediction = model.predict(xhat, batch_size=32) ## , batch_size=32 없어도 별 문제 없다.
    predictions[i] = prediction
    xhat = np.hstack([xhat[:,1:],prediction])
tt = x_test[0, None]
print(tt.shape,'\t',tt.ndim)
(1, 40) 2
xhat.shape
(1, 40)
print(look_ahead)
250
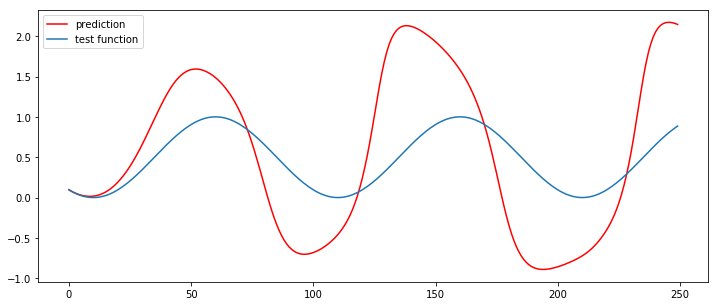
# 결과 그려서 비교하기 #250개에 대해서, 그리기
plt.figure(figsize=(12,5))
plt.plot(np.arange(look_ahead),predictions,'r',label="prediction")
plt.plot(np.arange(look_ahead),y_test[:look_ahead],label="test function")
plt.legend()
plt.show()

순환신경망 모델
# 필요 libraray 불러오기
import numpy as np
from keras.models import Sequential
from keras.layers import Dense, LSTM, Dropout
from sklearn.preprocessing import MinMaxScaler
import matplotlib.pyplot as plt
%matplotlib inline

# 위에와 동일하게 전재
# 1. 데이터셋 생성하기
signal_data = np.cos(np.arange(1600)*(20*np.pi/1000))[:,None]
# 데이터 전처리
scaler = MinMaxScaler(feature_range=(0, 1))
signal_data = scaler.fit_transform(signal_data)
# 데이터 분리
train = signal_data[0:800]
val = signal_data[800:1200]
test = signal_data[1200:]
# 데이터셋 생성
x_train, y_train = create_dataset(train, look_back)
x_val, y_val = create_dataset(val, look_back)
x_test, y_test = create_dataset(test, look_back)
print(signal_data[0:3,0].shape)
print("x_train.shape",x_train.shape) # 1행이 40개의 timestamp 이고, feature 는 그 자체 1개이다. 즉1개행은 40개의 time stamp 를 가진 값이다. 1차원 벡터이다.
print("x_val.shape",x_val.shape,"x_test.shape",x_test.shape)
(3,)
x_train.shape (760, 40)
x_val.shape (360, 40) x_test.shape (360, 40)
# 데이터셋 전처리
x_train = np.reshape(x_train, (x_train.shape[0], x_train.shape[1], 1))
x_val = np.reshape(x_val, (x_val.shape[0], x_val.shape[1], 1))
x_test = np.reshape(x_test, (x_test.shape[0], x_test.shape[1], 1))
print("x_train.shape",x_train.shape) # 3d tensor 로 만들었음. feature 는 1개이며, timestamp 가 40임. 이는 "keras창시자~"의 책에서 언급했던, timeseries의 input shape가 3D tensor 란 점과
## 일맥상통한다.
print("x_val.shape",x_val.shape,"x_test.shape",x_test.shape)
x_train.shape (760, 40, 1)
x_val.shape (360, 40, 1) x_test.shape (360, 40, 1)
# 2. 모델 구성하기
model_lstm = Sequential()
model_lstm.add(LSTM(32,
               dropout=0.05,
               recurrent_dropout=0.1,
               input_shape=(40, 1))) # input_shape 에서, 항상 batch_size 는 생략이다.  # 원본은 input_shape = (None,1)
# model_lstm.add(Dropout(0.3)) ## 이 부분은 keras 창시자 책과 다른부분이다. 책에서는 순환신경망에서, Dropout 을 일률적으로 때리면, 안된다고 한다.
model_lstm.add(Dense(1))
# compare with model_lstm
model_lstm_origin = Sequential()
model_lstm_origin.add(LSTM(32, input_shape=(None, 1)))
model_lstm_origin.add(Dropout(0.3))
model_lstm_origin.add(Dense(1))
# 3. 모델 학습과정 설정하기
model_lstm.compile(loss='mean_squared_error', optimizer='adam', metrics=['MAE'])
model_lstm_origin.compile(loss='mean_squared_error', optimizer='adam', metrics=['MAE'])
# 4. 모델 학습시키기 it takes too long time.....but im wating for you~
hist_lstm = model_lstm.fit(x_train, y_train, epochs=200, batch_size=32, validation_data=(x_val, y_val),verbose=False)
hist_lstm_origin = model_lstm_origin.fit(x_train, y_train, epochs=200, batch_size=32, validation_data=(x_val, y_val),verbose=False)
# 5. 학습과정 살펴보기 hist_lstm using recurrent drop out
plt.plot(hist_lstm.history['loss'])
plt.plot(hist_lstm.history['val_loss'])
plt.title("hist_lstm_JJH_opinion")
plt.ylim(0.0, 0.15)
plt.ylabel('loss')
plt.xlabel('epoch')
plt.legend(['train', 'val'], loc='upper left')
plt.show()

# 5. 학습과정 살펴보기 hist_lstm_origin
plt.plot(hist_lstm_origin.history['loss'])
plt.plot(hist_lstm_origin.history['val_loss'])
plt.ylim(0.0, 0.15)
plt.title("hist_lstm_origin")
plt.ylabel('loss')
plt.xlabel('epoch')
plt.legend(['train', 'val'], loc='upper left')
plt.show()

그림으로 보자면, hist_lstm_origin (순환형 네특웍에서, gate의 drop-out 조절없이 그냥 적용한것) 이, val_loss 가 낮게 나오며
과적합을 피하는데있어서, 더 나아 보인다. 아직 속단하기에는 이르니, 모델 결과를 이어서 살펴보면
# 모델 평가하기 - model_lstm
trainScore = model_lstm.evaluate(x_train, y_train, verbose=0)
model_lstm.reset_states()
print('Train Score: ', trainScore)
valScore = model_lstm.evaluate(x_val, y_val, verbose=0)
model_lstm.reset_states()
print('Validataion Score: ', valScore)
testScore = model_lstm.evaluate(x_test, y_test, verbose=0)
model_lstm.reset_states()
print('Test Score: ', testScore)
Train Score:  [0.0005853483845528804, 0.019910712795037974]
Validataion Score:  [0.0005796171200927347, 0.019753878853387304]
Test Score:  [0.0005796171200927347, 0.019753878853387304]
# 6. 모델 평가하기 - model_lstm_origin
trainScore = model_lstm_origin.evaluate(x_train, y_train, verbose=0)
model_lstm_origin.reset_states()
print('Train Score: ', trainScore)
valScore = model_lstm_origin.evaluate(x_val, y_val, verbose=0)
model_lstm_origin.reset_states()
print('Validataion Score: ', valScore)
testScore = model_lstm_origin.evaluate(x_test, y_test, verbose=0)
model_lstm_origin.reset_states()
print('Test Score: ', testScore)
Train Score:  [2.0208918622780688e-05, 0.004060829646493259]
Validataion Score:  [2.0516756113566874e-05, 0.004088579035467572]
Test Score:  [2.0516756113566874e-05, 0.004088579035467572]
loss 값은 오리지널이 확실히 낮지만, acc 값은 model_lstm 방식이 더 높다. 그림으로 살펴보자
# 7. 모델 사용하기
look_ahead = 250
xhat = x_test[0]
predictions = np.zeros((look_ahead,1))
for i in range(look_ahead):
    prediction = model_lstm.predict(np.array([xhat]), batch_size=1)
    predictions[i] = prediction
    xhat = np.vstack([xhat[1:],prediction])

plt.figure(figsize=(12,5))
plt.title("model_lstm_recurrent_drop_out")
plt.plot(np.arange(look_ahead),predictions,'r',label="prediction")
plt.plot(np.arange(look_ahead),y_test[:look_ahead],label="test function")
plt.legend()
plt.show()

# 7. 모델 사용하기
look_ahead = 250
xhat = x_test[0]
predictions = np.zeros((look_ahead,1))
for i in range(look_ahead):
    prediction = model_lstm_origin.predict(np.array([xhat]), batch_size=1)
    predictions[i] = prediction
    xhat = np.vstack([xhat[1:],prediction])

plt.figure(figsize=(12,5))
plt.title("model_lstm_separate_drop_out")
plt.plot(np.arange(look_ahead),predictions,'r',label="prediction")
plt.plot(np.arange(look_ahead),y_test[:look_ahead],label="test function")
plt.legend()
plt.show()

일단 별도의, 분리된 drop out layer 를 가져갔던 모델이, 좀더 나은 결과를 보인다. 이유는 알수없다.. 만약 dropout 이 없는 모델을 돌려보면,
# compare with model_lstm
model_lstm_nodrop = Sequential()
model_lstm_nodrop.add(LSTM(32, input_shape=(None, 1)))
# model_lstm_origin.add(Dropout(0.3))
model_lstm_nodrop.add(Dense(1))
# 3. 모델 학습과정 설정하기
model_lstm_nodrop.compile(loss='mean_squared_error', optimizer='adam', metrics=['MAE'])
# 4. 모델 학습시키기 it takes too long time.....but im wating for you~
hist_lstm_nodrop = model_lstm_nodrop.fit(x_train, y_train, epochs=200, batch_size=32, validation_data=(x_val, y_val),verbose=False)
# 5. 학습과정 살펴보기 hist_lstm_origin
plt.plot(hist_lstm_nodrop.history['loss'])
plt.plot(hist_lstm_nodrop.history['val_loss'])
plt.ylim(0.0, 0.15)
plt.title("hist_lstm_nodrop")
plt.ylabel('loss')
plt.xlabel('epoch')
plt.legend(['train', 'val'], loc='upper left')
plt.show()

# 7. 모델 사용하기
look_ahead = 250
xhat = x_test[0]
predictions = np.zeros((look_ahead,1))
for i in range(look_ahead):
    prediction = model_lstm_nodrop.predict(np.array([xhat]), batch_size=1)
    predictions[i] = prediction
    xhat = np.vstack([xhat[1:],prediction])

plt.figure(figsize=(12,5))
plt.title("hist_lstm_nodrop")
plt.plot(np.arange(look_ahead),predictions,'r',label="prediction")
plt.plot(np.arange(look_ahead),y_test[:look_ahead],label="test function")
plt.legend()
plt.show()

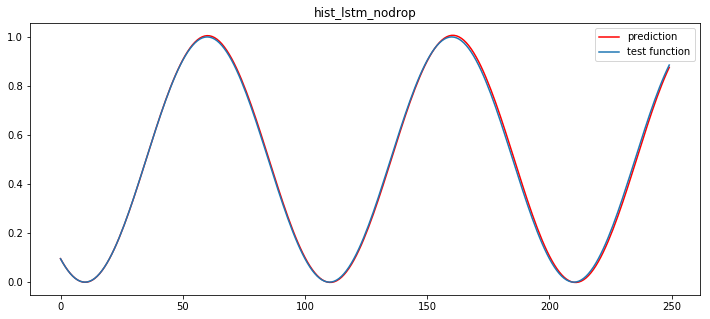
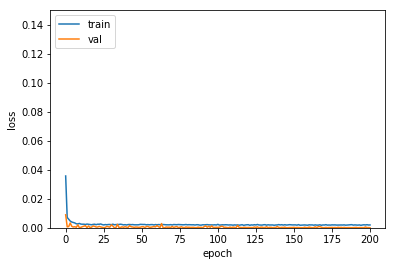
drop 옵션을 주지 않았더니, 너무 과적합되었다.
drop 을 주는 것은 필수인데, 의외로, 별도의 drop 층 역시, 효과가 있어보인다.
recurrent drop 층의 경우에는 확실히 정확한 Tunning 이 필요해 보인다.
상태유지 순환신경망 모델
class CustomHistory(keras.callbacks.Callback):
    def init(self):
        self.train_loss = []
        self.val_loss = []

    def on_epoch_end(self, batch, logs={}):
        self.train_loss.append(logs.get('loss'))
        self.val_loss.append(logs.get('val_loss'))
look_back = 40
# 데이터 분리
train = signal_data[0:800]
val = signal_data[800:1200]
test = signal_data[1200:]

# 데이터셋 생성
x_train, y_train = create_dataset(train, look_back)
x_val, y_val = create_dataset(val, look_back)
x_test, y_test = create_dataset(test, look_back)

# 데이터셋 전처리
x_train = np.reshape(x_train, (x_train.shape[0], x_train.shape[1], 1))
x_val = np.reshape(x_val, (x_val.shape[0], x_val.shape[1], 1))
x_test = np.reshape(x_test, (x_test.shape[0], x_test.shape[1], 1))
stateful 에서, default 는 False 인데,
stateful=True : 이번 배치의 마지막 state 값을 활용한다는 의미
stateful=False : 이번 배치와 무관하게, state 메모리값을 처음부 다시 학습
np.random.randint(0,10,(3, 2, 2)) ## 참조 함수
array([[[1, 3],
        [7, 4]],

       [[5, 0],
        [0, 9]],

       [[1, 9],
        [4, 9]]])
# 2. 모델 구성하기
model = Sequential()
model.add(LSTM(32, batch_input_shape=(1, look_back, 1), stateful=True))
model.add(Dropout(0.3))
model.add(Dense(1))

# 3. 모델 학습과정 설정하기
model.compile(loss='mean_squared_error', optimizer='adam', metrics=['MAE'])

# 4. 모델 학습시키기
custom_hist = CustomHistory()
custom_hist.init()
x_train.shape
(760, 40, 1)
## 특이하게 epochs 를 1로 , batch_size = 1 로 하고, 수동으로 200 번을 돌린다. 이것의 의미는?
## 이전 state 그니깐. memory cell 정보를 그대로 유지하기 위해선, 하기와 같은 for문을 사용한다. 상세한 내용은 blog 참조가 필요하다.
for i in range(200):
    model.fit(x_train, y_train, epochs=1, batch_size=1, shuffle=False, callbacks=[custom_hist], validation_data=(x_val, y_val),verbose=False)
    model.reset_states()
# 5. 학습과정 살펴보기
plt.plot(custom_hist.train_loss)
plt.plot(custom_hist.val_loss)
plt.ylim(0.0, 0.15)
plt.ylabel('loss')
plt.xlabel('epoch')
plt.legend(['train', 'val'], loc='upper left')
plt.show()

# 6. 모델 평가하기
trainScore = model.evaluate(x_train, y_train, batch_size=1, verbose=0)
model.reset_states()
print('Train Score: ', trainScore)
valScore = model.evaluate(x_val, y_val, batch_size=1, verbose=0)
model.reset_states()
print('Validataion Score: ', valScore)
testScore = model.evaluate(x_test, y_test, batch_size=1, verbose=0)
model.reset_states()
print('Test Score: ', testScore)
Train Score:  [7.02237954851102e-05, 0.007264555177014125]
Validataion Score:  [7.210089544247782e-05, 0.007376509128759304]
Test Score:  [7.210089544247782e-05, 0.007376509128759304]
# 7. 모델 사용하기
look_ahead = 250
xhat = x_test[0]
predictions = np.zeros((look_ahead,1))
for i in range(look_ahead):
    prediction = model.predict(np.array([xhat]), batch_size=1)
    predictions[i] = prediction
    xhat = np.vstack([xhat[1:],prediction])

plt.figure(figsize=(12,5))
plt.plot(np.arange(look_ahead),predictions,'r',label="prediction")
plt.plot(np.arange(look_ahead),y_test[:look_ahead],label="test function")
plt.legend()
plt.show()

좀 구리게 나왔다.


Comments