Covariance Using Python
PCA 활용해서, covariance 값 비교하기
reference
- COV 개념관련_01 : (https://ratsgo.github.io/linear%20algebra/2017/03/14/operations/)
- PCA 개념관련_02 : (https://ratsgo.github.io/from%20frequency%20to%20semantics/2017/04/06/pcasvdlsa/)
import pandas as pd
import numpy as np
import random as rd
from sklearn.decomposition import PCA
x = [1,2,3,4]
y = [4,3,2,1]
z = [3,5,2,7]
X = np.stack((x, y, z), axis=0)
print(X.shape)
(3, 4)
X = X.T
print(X.shape)
(4, 3)
X
array([[1, 4, 3],
       [2, 3, 5],
       [3, 2, 2],
       [4, 1, 7]])
from sklearn import preprocessing
sc = preprocessing.StandardScaler()
scaled_X = sc.fit_transform(X)
sc.mean_
array([2.5 , 2.5 , 4.25])
print(scaled_X.shape)
scaled_X
(4, 3)

array([[-1.34164079,  1.34164079, -0.65094455],
       [-0.4472136 ,  0.4472136 ,  0.39056673],
       [ 0.4472136 , -0.4472136 , -1.1717002 ],
       [ 1.34164079, -1.34164079,  1.43207802]])
n_components : Number of components to keep. if n_components is not set all components are kept
pca_01 = PCA(n_components=None,svd_solver='full') # create a PCA object ## n_components == min(n_samples, n_features)
pca_01.fit(X) # do the math => eigen decomposition 이 이루어진다.
PCA(copy=True, iterated_power='auto', n_components=None, random_state=None,
    svd_solver='full', tol=0.0, whiten=False)
pca_02 = PCA(n_components=None,svd_solver='full') # create a PCA object ## n_components == min(n_samples, n_features)
pca_02.fit(scaled_X) # do the math => eigen decomposition 이 이루어진다.
PCA(copy=True, iterated_power='auto', n_components=None, random_state=None,
    svd_solver='full', tol=0.0, whiten=False)
## if 'pca_01 =  PCA(n_components=2,svd_solver='full')' then 'n_components_ would be 2'
pca_01.n_components_
3
decomp_X = pca_01.transform(X)
## ## if 'pca_01 =  PCA(n_components=2,svd_solver='full')' then 'decomp_X.shape would be (4,2)'
print(decomp_X.shape)
decomp_X
(4, 3)
array([[-2.23651603e+00, -1.02980390e+00,  3.01217567e-16],
       [ 2.12881542e-01, -1.00855414e+00,  3.07767591e-16],
       [-1.44509325e+00,  1.86392207e+00, -4.79213562e-16],
       [ 3.46872773e+00,  1.74435960e-01, -1.29771595e-16]])
pca_01 (sclae 조정하지 않은 X) 의 corvariance
print(pca_01.get_covariance().shape)
pca_01.get_covariance()
(3, 3)
array([[ 1.66666667, -1.66666667,  1.5       ],
       [-1.66666667,  1.66666667, -1.5       ],
       [ 1.5       , -1.5       ,  4.91666667]])
pca_02 (sclae 조정한 X) 의 corvariance
print(pca_02.get_covariance().shape)
pca_02.get_covariance()
(3, 3)
array([[ 1.33333333, -1.33333333,  0.69866701],
       [-1.33333333,  1.33333333, -0.69866701],
       [ 0.69866701, -0.69866701,  1.33333333]])
그냥 Numpy 로 구하기
공분산을 구할때, scaled_X 를 그대로 활용하는 건 어렵다.
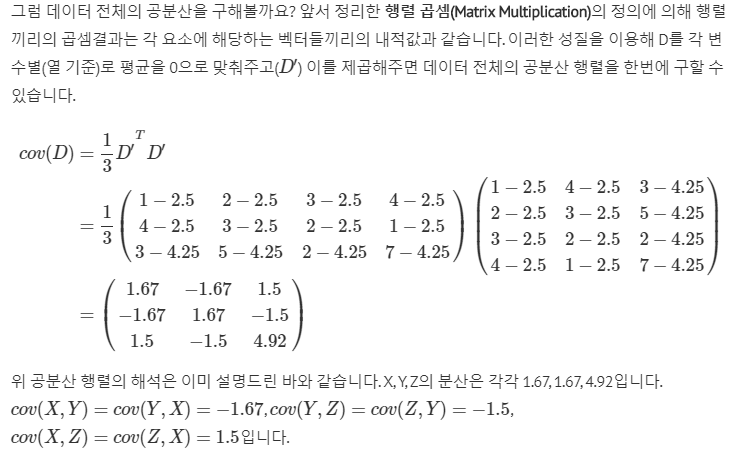
상기 설명처럼, D’ 는 표준화된 행렬이 아니라, 평균만 제거된 행렬이다.
따라서, scaled_X 를 그대로 활용하기는 어렵다.
sc.mean_
array([2.5 , 2.5 , 4.25])
(X-sc.mean_)
array([[-1.5 ,  1.5 , -1.25],
       [-0.5 ,  0.5 ,  0.75],
       [ 0.5 , -0.5 , -2.25],
       [ 1.5 , -1.5 ,  2.75]])
print(X.shape)
k = X.shape[0]-1
print(k)
(4, 3)
3
scale 되지 않은 X 의 covariance
(1/k)*np.dot(X.T-sc.mean_.reshape(-1,1),X-sc.mean_)
array([[ 1.66666667, -1.66666667,  1.5       ],
       [-1.66666667,  1.66666667, -1.5       ],
       [ 1.5       , -1.5       ,  4.91666667]])
scaled_X의 covariance
## scaled_X 의 평균은 0, 편차는 1 이기 때문에, 상대적으로 편하다.
(1/k)*np.dot(scaled_X.T,scaled_X)
array([[ 1.33333333, -1.33333333,  0.69866701],
       [-1.33333333,  1.33333333, -0.69866701],
       [ 0.69866701, -0.69866701,  1.33333333]])
Numpy 의 Covariance 값 구하기
scale 되지 않은 X 의 covariance
np_cov = np.cov(X,rowvar=False)
print(np_cov.shape)
print(np_cov)
(3, 3)
[[ 1.66666667 -1.66666667  1.5       ]
 [-1.66666667  1.66666667 -1.5       ]
 [ 1.5        -1.5         4.91666667]]
scaled_X의 covariance
np_cov = np.cov(scaled_X,rowvar=False)
print(np_cov.shape)
print(np_cov)
(3, 3)
[[ 1.33333333 -1.33333333  0.69866701]
 [-1.33333333  1.33333333 -0.69866701]
 [ 0.69866701 -0.69866701  1.33333333]]
row cnt < column cnt 일때 PCA은 어떻게 적용되나?
X
array([[1, 4, 3],
       [2, 3, 5],
       [3, 2, 2],
       [4, 1, 7]])
x = [1,2,3,4,5,6,7,8,9,10]
y = [10,9,8,7,6,5,4,3,2,1]
z = [3,5,2,7,3,4,11,2,4,5]
X2 = np.stack((x, y, z), axis=0)
print(X2.shape)
(3, 10)
pca_03 = PCA(n_components=None,svd_solver='full') # create a PCA object ## n_components == min(n_samples, n_features)
pca_03.fit(X2) # do the math => eigen decomposition 이 이루어진다.
transformed_pca_03 = pca_03.transform(X2)
print(pca_03.get_covariance().shape)
print("PCA 분석으로 origin 행렬에 vector변환한 행렬 : {}".format(transformed_pca_03.shape))
print(" A행렬의 고유벡터(eigen vactor) 행렬 P: {}".format(pca_03.components_.shape))
print(" A행렬의 고유치(eigen value) 대각행렬 lambda diag: {}".format(np.diag(pca_03.explained_variance_).shape))
(10, 10)
PCA 분석으로 origin 행렬에 vector변환한 행렬 : (3, 3)
 A행렬의 고유벡터(eigen vactor) 행렬 P: (3, 10)
 A행렬의 고유치(eigen value) 대각행렬 lambda diag: (3, 3)
일단, column 기준으로PCA가 수행된다. 따라서, cov 는 컬럼끼리의 관계이니만큼 10 by 10 의 행렬을 가진다.
pca_03.get_covariance()[0]
array([ 22.33333333,  16.16666667,  14.16666667,   5.5       ,
         4.33333333,  -1.        , -11.33333333,  -8.33333333,
       -14.5       , -19.83333333])
a = np.dot(pca_03.components_.T,np.diag(pca_03.explained_variance_))
b = np.dot(a,pca_03.components_)
print(b.shape) ## Covariance
b[0]
(10, 10)
array([ 22.33333333,  16.16666667,  14.16666667,   5.5       ,
         4.33333333,  -1.        , -11.33333333,  -8.33333333,
       -14.5       , -19.83333333])
상기처럼 역산으로 cov 값을 구할 수 있다.
그런데 transformed_pca_03 값을 구할때는 scale 조정으로 정확하게 일치하지는 않는다. 이는 scale 조정이후 일치하는 것을 알 수 있다.
np.dot(X2,pca_03.components_.T)
array([[-8.69634179, -6.36804112, 12.04501293],
       [ 9.43294049, -5.21516461, 12.04501293],
       [-1.49151616,  2.63698458, 12.04501293]])
transformed_pca_03
array([[-8.44470263e+00, -3.38596740e+00, -2.22044605e-16],
       [ 9.68457964e+00, -2.23309089e+00, -1.44328993e-15],
       [-1.23987701e+00,  5.61905829e+00,  3.66373598e-15]])
scale 조정이후, 선형변환한 값과 결과값의 직접비교
scaled_X2 = sc.fit_transform(X2)
pca_04 = PCA(n_components=None,svd_solver='full') # create a PCA object ## n_components == min(n_samples, n_features)
transformed_pca_04 = pca_04.fit_transform(scaled_X2) # do the math => eigen decomposition 이 이루어진다.
np.dot(scaled_X2,pca_04.components_.T)
array([[ 3.14509179e+00, -1.26888328e+00, -4.44089210e-16],
       [-3.01908214e+00, -1.43468439e+00, -1.33226763e-15],
       [-1.26009655e-01,  2.70356767e+00,  1.69309011e-15]])
transformed_pca_04
array([[ 3.14509179e+00, -1.26888328e+00,  2.61011692e-16],
       [-3.01908214e+00, -1.43468439e+00,  2.61011692e-16],
       [-1.26009655e-01,  2.70356767e+00,  2.61011692e-16]])
row cnt > column cnt 일때 PCA은 어떻게 적용되나?
X3 = X2.T
print(X3.shape)
X3
(10, 3)
array([[ 1, 10,  3],
       [ 2,  9,  5],
       [ 3,  8,  2],
       [ 4,  7,  7],
       [ 5,  6,  3],
       [ 6,  5,  4],
       [ 7,  4, 11],
       [ 8,  3,  2],
       [ 9,  2,  4],
       [10,  1,  5]])
pca_05 = PCA(n_components=None,svd_solver='full') # create a PCA object ## n_components == min(n_samples, n_features)
pca_05.fit(X3) # do the math => eigen decomposition 이 이루어진다.
transformed_pca_05 = pca_05.transform(X3)
print(pca_05.get_covariance().shape)
print("PCA 분석으로 origin 행렬에 vector변환한 행렬 : {}".format(transformed_pca_05.shape))
print(" A행렬의 고유벡터(eigen vactor) 행렬 P: {}".format(pca_05.components_.shape))
print(" A행렬의 고유치(eigen value) 대각행렬 lambda diag: {}".format(np.diag(pca_05.explained_variance_).shape))
(3, 3)
PCA 분석으로 origin 행렬에 vector변환한 행렬 : (10, 3)
 A행렬의 고유벡터(eigen vactor) 행렬 P: (3, 3)
 A행렬의 고유치(eigen value) 대각행렬 lambda diag: (3, 3)
SVD (sigular Value Decomposition)
X
array([[1, 4, 3],
       [2, 3, 5],
       [3, 2, 2],
       [4, 1, 7]])
from scipy import linalg
U, s, Vh = linalg.svd(X)
U.shape,  s.shape, Vh.shape
((4, 4), (3,), (3, 3))


Comments